| Experimental Noise in Data Acquisition and Evaluation.
I. Noise Amplitude Distribution Function on High-Resolution FT-NMR Instruments.
II. Signal-to-Noise Ratio Measurements in NMR.
|
by Stanislav Sýkora and Juerg Vogt
Scanned from Bruker Report 2/79, pages 15-18, 1979.
|
|
Abstracts
I.
The noise reaching the analog-digital coverter of a HR-NMR instrument has
been analysed for any deviations from normal distribution. Several statistical
normality tests had been employed, such as skewness, curtosis, second and
fourth moment and the correlation between them. It has been found that any such
deviation, if present at all, is below the threshhold of detection at
95% confidence level. Tentative reasons for this fact are listed.
The fact that the noise is indeed normal implies that standard data averaging
techniques are indeed the optimal ones and it has no sense to look
for better ones.
II.
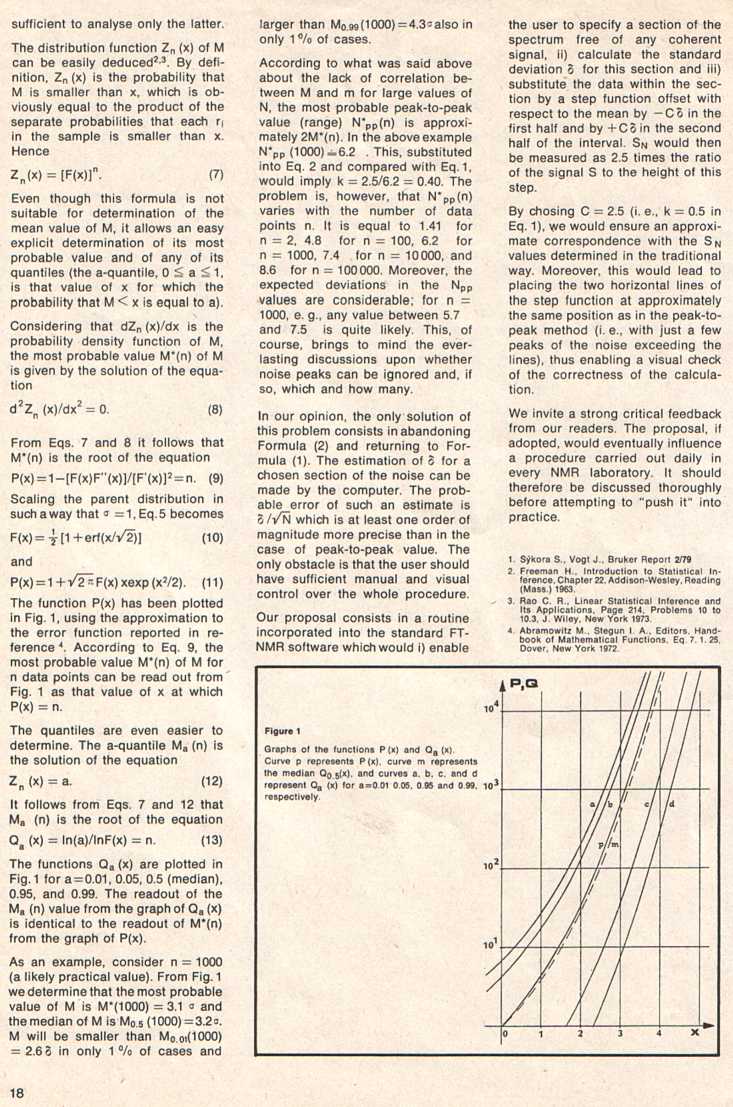
The simple way of estimating the signal-to-noise ratio (S/N) in HR-NMR spectra
consists of estimating the height of a standard peak (Ph) and the peak-to-peak
amplitude of a segment of the spectrum containing only noise (Na) and setting
S/N = 2.5*(Ph/Na). This Note investigates to which extent such a procedure can
be considered objective and reliable. The maximum and the minimum of a segment
of noise with n data points is a well-defined random variable whose statistical
properties can be easily analysed. In particular, its median and quantiles
for any confidence level are given by explicit formulae. From these it follows
that the standard method is depends too much of the size of the noise segment
and should be therefore replaced by a more sophisticated method.
PDF version (1002 kBytes)
|
|
|