|
1. Introduction
One of the most interesting phenomena in variable-field nuclear magnetic resonance relaxometry (VF-MRR) is the occurrence of the so-called nitrogen glitches in the proton relaxation dispersion curves (1H NMRD profiles) of solid and semi-solid substances containing protonated nitrogens. An example of such glitches is shown in the Figure on the right (solid BSA data acquired by the Author) and many more are scattered through the literature on fast-field-cycling NMR relaxometry (FFC NMR).
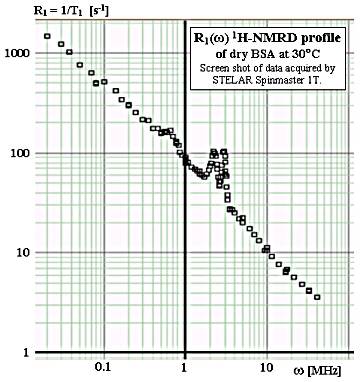
The relatively straightforward physical origin of the glitches has been analyzed in detail by F.Winter and R.Kimmich [1-3]. Due to the spin of the 14N nuclide (S=1) and to its relatively strong quadrupole moment, the field dependence of 14N resonance frequencies differs qualitatively from that of 1H (S=1/2 and no quadrupole moment). Each of the three ω(B) curves of the three 14N transitions presents an intersection with the ω(B) straight line for the protons. A match between the transition frequencies of the two nuclidees permits an efficient transfer of magnetization from the slowly-relaxing protons toward the much faster relaxing nitrogens. The result is the appearance of resonance-like, sharp increase in the proton relaxation rate at particular field values, nicknamed relaxation rate nitrogen glitches or, alternatively, relaxation time nitrogen dips.
The importance of the glitches is progressively mounting. They are used as a sensitive probe of molecular motions and their isotropy in solid and semi-solid substances [2-10], including biological tissues [2-4]. Recently, they found potentially viable applications in fields as disparate as remote detection of explosives [9,10] and, in MRI, imaging of muscle tissues [4-7] uncontaminated by fat and water signals.
The glitches can be observed only when molecular rotations are less frequent than the NMR relaxation rates. When this is not true, molecular rotation averages out the dipolar coupling interaction between the two types of nuclidees and effectively closes the cross-relaxation channel. The strongest nitrogen glitches therefore occur in solids containing protonated nitrogens where the dipolar interactions are strong and molecular rotations are absent. In such systems, moreover, efficient spin-diffusion of magnetization provides a path allowing the magnetization of all the protons to reach the nitrogens.
In the view of the above considerations, when looking for systems with the strongest possible nitrogen glitches, one is inevitably directed towards solid urea [H2N.CO.NH2] with its abundance of both nitrogens and directly bonded protons (molar concentration about 80% that of protons in water). Solid urea is also expected to be completely free of molecular motions because of the N-H-O hydrogen bridges which are likely to make its solid structure extremely rigid.
Trying to collect illustrative material on FFC NMR relaxometry, the Author has tried to measure the longitudinal proton relaxation profile of solid urea, hoping to detect particularly representative nitrogen glitches. However, for reasons described below, the attempt has failed and, in addition, opened an NMR 'mystery' which is yet to be solved.
In this context it is interesting to note that there are virtually no relaxation data on solid urea available anywhere in the literature. The Author has found a brief mention of the piezoelectric disturbance in urea in a paper by R.Kimmich. Though I am at present unable to locate the sentence among the multitude of Kimmich's papers, there is no doubt that he - and most probably many others - has encountered the same difficulties described here and simply gave up.
2. Experimental procedure
The urea used in this work was a 99% pure A.C.S. reagent purchased from Sigma-Aldrich, with melting point of 135 °C and density of 1.335.
Two samples were prepared in sealed 10 mm o.d. tubes (8 mm i.d.): one of a packed powder and one, weighing 1 g, gently melted at 140 °C and then allowed to cool rather fast at room temperature. The samples were not specially degassed and therefore contained atmospheric oxygen.
A sample of commercial perspex was used for comparison purposes and for testing of the instrumental set-up. It was shaped as a cylinder of about 8 mm diameter and 10 mm height, with a total weight of about 500 mg (half that of the sample of re-crystallized urea).
Measurements were carried out in two different sessions using the Stelar Spinmaster FFC 1T fast-field-cycling NMR relaxometer produced by Stelar srl in Mede, Italy. All measurements were taken at room temperature. Parameter settings other than temperature varied considerably during the meticulous but unsuccessful search for the urea NMR signal and are reported below on a case-by-case basis.
3. Discussion of experimental results
Anomalous, field independent FID
The powder sample showed a weak FID of an unruly and quite improbable shape. It soon turned out that this was not an NMR signal at all since it persisted even with the magnetic field switched off. The usual explanation in these cases is piezoelectricity (an alternative might be acoustic ringing but that necessarily disappears in zero field).
Piezoelectric problems can be sometimes mitigated by fusing and re-crystallizing the material. This is what has been tried in this case but the situation did not change. The false signal from the re-crystallized sample is actually even higher than that from the powder (probably due to higher overall density), indicating that we are in the presence of internal piezoelectric vibrations of individual crystal domains present even when the domain boundaries are subject to mechanic constrains.
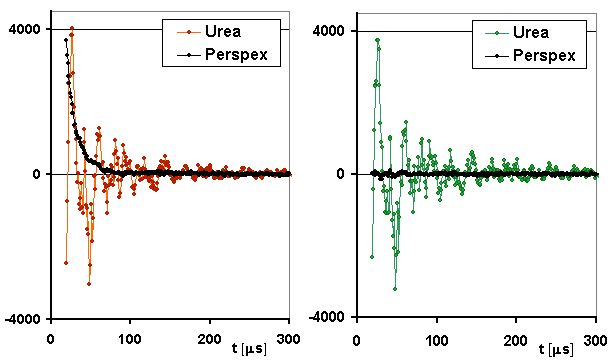
All the urea data reported in this Note were obtained from the re-crystallized sample. Figure 2 (below) shows the transient sample response to a simple 90-degrees RF pulse, together with the response of the perplex sample which was in this case expected to give a typical rigid-solid signal with roughly half the height of that of the urea sample.
Fig.2. Responses of the urea (colored dots) and perspex (black dots) samples
to an RF Pulse in the presence (left) and absence (right) of magnetic field.
In all cases, the RF pulse had a frequency of 10.724 MHz and duration of 6 μs, corresponding to the 90-degrees nutation angle. In the left graph matched the field value was adjusted to make the Larmor frequency of protons match the RF carrier frequency. The receiver-system dead time was about 19 μs and was responsible for the decay of the perspex signal on the left to approximately half its initial value before the start of detection. The arbitrarily chosen vertical scale units are identical for all the plotted experimental curves. All the transients shown in this Note are averages of 512 scans.
Ruling out acoustic ringing effects
Apparently the most striking feature of the data shown in Figure 1 is the presence of the urea 'signal' even in the absence of magnetic field (the green trace on the right). This definitely rules out that it might be an NMR signal, as well as an acoustic ringing problem (acoustic ringing might have a similar look but, by its very nature, would have to disappear in the absence of field). The only remaining plausible hypothesis about the origin of the signal is a strong piezoelectricity of the polycrystalline sample.
Missing relaxation behavior
Though the urea signals shown in Figure 2 is by itself puzzling enough, it does not tell the whole story. First of all, there is a remarkable difference of behavior of the two samples with respect to how long before the RF pulse is the magnetic field switched ON. On FFC-NMR instruments the field is normally OFF and switching it ON a time τ before excitation and acquisition is one of the standard ways to follow the build-up of nuclear magnetization and measure its relaxation rate. In the case of perspex a τ interval of about 400 ms was necessary to make sure that its magnetization reached the equilibrium state. At τ=200ms the drop in the perspex signal intensity was quite obvious and it was virtually absent for τ values smaller than 10 ms. The urea signal, on the contrary, does not show any dependence upon τ (hence the impossibility to measure the NMR relaxation rates of urea) and its absolute magnitude remains constant down to τ=0.
Unlikely complexity of the urea response
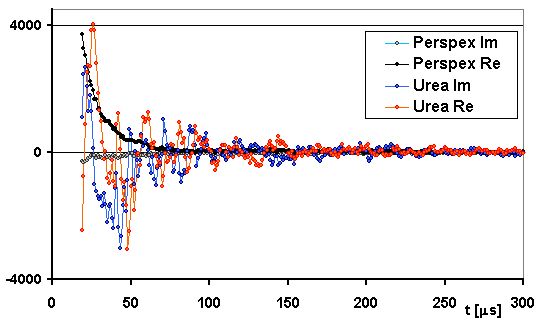
Another difference between the two signals is the extreme phase complexity of the urea response at the output of a standard phase detector. Figure 3 shows the in-phase ('real') and out of phase ('imaginary') components of the response for both compounds. Because of careful adjustment of the receiver phase, the complex signal from perspex shows a large real component and a small imaginary component, both of which behave smoothly and clearly correlate with each other. The two signal components from urea, however, behave in an extremely unruly way and do not appear to be correlated - a feature which would be absurd in any true NMR signal.
Fig.3. Real (Re) and imaginary (Im) components
of the urea and perspex signals at resonance magnetic field.
Experimental conditions are the same as in Fig.2.
Coherence and correlation with the RF-pulse phase
Despite all the differences, the signals obtained from perspex and urea do have also some common features. One is that both disappear when the RF pulse is suppressed. This, of course, may appear as a triviality but it is still comforting to have the proof that, in both cases, we are looking at a transient excited by the RF pulse and not at some instrumental artifact.
Somewhat less trivial is the perfect coherence of the urea response during the accumulation of consecutive transients (scans). The shape of the growing signal remains exactly the same regardless of the number of collected transients (tested in the range from 10 to 10000 scans). This is less trivial than it seems since reproducibility of signals from piezoelectric powders is sometimes poor due to the relative motion of individual grains when subject to RF pulses. In this case, the fact that the sample was melted and re-solidified clearly helps.
Another similarity is the behavior of the signals under standard RF-pulse phase-cycling. Considering the apparent near randomness of the urea response, it is a bit surprising to find out that it strictly follows that of the RF pulse and accumulates coherently under all NMR phase-cycling schemes. Several tests of this fact were carried out (no phase cycle, simple alternating pulse and cyclops). They are not shown here simply because all the outcomes were perfectly identical.
Spectra of the urea responses
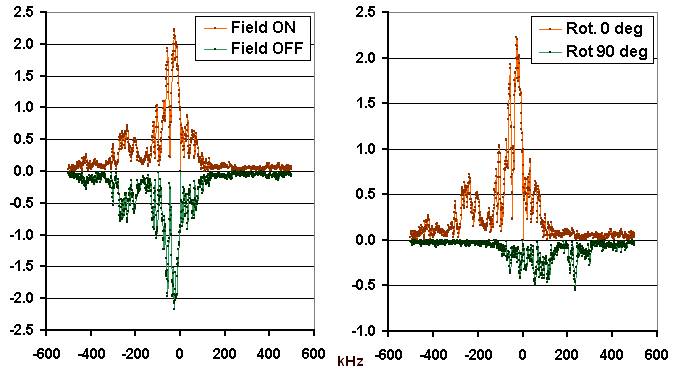
Figure 4 shows the magnitude spectra of the signals received from the urea sample under different conditions. The reddish traces are identical and were obtained by means of digital Fourier transform of the field-ON transient response of Figure 2. What catches attention is the extreme width of the spectral pattern. The spectral region containing distinguishable signal spans more than 5 MHz (the scale labels are in kHz!) and therefore exceeds the bandwidth of the probe and receiver channel which was about 1 MHz.
From the instrumental point of view, this means that the measured spectra are attenuated in the wings and the actual spectral width of the response is even larger than what we observe. Since there are no known NMR interactions of comparable intensity, this is a further indication of the fact that what we observe here has nothing to do with nuclear magnetization. For comparison, the magnitude spectrum of the perspex sample shows a superposition of two perfectly centered and roughly Lorentzian lines with half-height widths of 8 kHz and 20 kHz, respectively.
Fig.4. Spectra of the urea responses.
Upper traces (reddish): Magnitude spectrum of the transient time-domain response shown in Fig.2. with the magnetic field switched ON. The lower trace on the left (green) is the magnitude spectrum of the transient signal obtained with the field switched OFF. It is plotted with negative sign in order to show the perfect symmetry of the two signals which are identical up to the experimental noise. The lower trace on the right (also green and inverted) has been obtained, like the upper trace, with the field switched ON but after the sample har been rotated by about 90 degrees around its field-aligned axis.
Missing NMR signal
The comparison between the urea responses with the field ON and OFF (Figure 4, left graph) indicates that the difference is virtually null. This means that the piezoelectric response can not be defined as a disturbance superposed over a legitimate NMR signal. If this were so, the transient responses would have to contain a legitimate FID component of a magnitude comparable to the observed disturbance which, evidently, is not the case.
To make sure that there is no observable remnant of the NMR signal, I have tried to apply sequences of the same type as those used to suppress acoustic ringing. This led to a nearly complete annihilation of the transients but never to a detection of any component which would be present at resonance field and absent at zero field.
Urea sample anisotropy
One interesting experiment consisted in rotating the sample by 90° around the field direction. This gave rise to a smaller transient with a different magnitude spectrum (Figure 4, right graph). This indicates that the sample was actually quite anisotropic, evidently due to the tendency of urea to rapidly grow quite large crystals when cooling down from melt.
Different carrier frequencies
Preliminary results indicate that all the above-described phenomena occur also when using carrier frequencies close to 15, 20, 25 and 30 MHz, rather than the starting 10.7 Hz. More detailed and quantitative investigations of variations linked to the choice of carrier frequency are currently in progress.
4. Conclusions
The empirically ascertained phenomena described in this Note include:
Broad-band piezoelectric response of solid urea to an RF pulse
The response is very strong and coherent with the phase of the RF pulse. In a poly-crystalline sample, the response is very complex both in time domain and in the frequency domain, where it spreads over at least 5 MHz around the carrier. There is no doubt that it is due to very strong piezoelectric characteristics of solid urea, even though direct experimental data on this matter could not be found.
Complete lack of any NMR signal
For carrier frequencies within the range 10-30 Mhz (at least) the expected NMR response of solid urea is completely missing. It is not as though it were obscured by an excessive piezoelectric disturbance. Rather, it appears to be really absent, indicating that the RF pulse gets probably modified to the point where it can not excite the urea protons. At present, the physical basis of this phenomenon is not clear.
The fact that piezoelectricity can make impossible NMR relaxometry measurements over broad ranges of carrier frequencies is rather frustrating since piezoelectric solids are quite common. A search for a suitable experimental technique permitting us to overcome this problem therefore becomes mandatory.
|